Data centers are large consumers of electricity, currently responsible for 1% of global usage according to the IEA. Whilst renewable electricity is on the rise, in 2021 over 61% of the world’s electricity was generated through burning fossil fuels, the dirtiest form of creating it (source: Electricity Mix by Our World In Data).
To get on track with the Net Zero Scenario, we must halve emissions by 2030. This means using a lot less electricity generated with fossil fuels. One approach to this is to make the most of renewable electricity when it is plentiful, for example on days when the wind is blowing strongly or sunlight levels are good. On such days, we would say the grid has a lower carbon intensity.
A data center can choose to make the most of such periods of low carbon intensity by scheduling a heavier workload during those times. When renewables are plentiful, do more work. When renewables are not, do the minimum. For example training a machine learning model could wait until a period of low carbon intensity.
This works especially well for distributed systems, where nodes may already exist in multiple physical locations. These locations may be in different countries powered by different electricity grids. A distributed system can therefore intelligently choose which locations have the lowest carbon intensity and run workloads there.
We refer to this as carbon aware scheduling.
In this post, I look at some approaches and tools that can be used to achieve carbon aware scheduling with Kubernetes and Nomad. These are the two most popular open source orchestrators that have powerful APIs for scheduling workloads.
Annotating nodes with carbon intensity data
Scheduling where a workload runs when multiple locations are available may not require real time data. However to schedule when workloads run real time data is required. It’s also beneficial to have forecast data for the next 24 or 48 hours.
To make these scheduling decisions we need to know the carbon intensity of the electricity supplied to each physical location.
Carbon intensity data sources
There are multiple sources for this data and more are being created. Some are country specific like carbonintensity.org.uk. There are also providers like WattTime and ElectricityMap that have APIs with coverage for multiple countries.
When running in the cloud the hyperscale cloud providers are starting to provide this data. For example Google provides carbon intensity data for each of their regions using data from ElectricityMap. They also highlight which regions have a low carbon intensity. There is also the open source Cloud Carbon Footprint tool that supports AWS, Azure and GCP and works by processing billing data.
Exposing carbon intensity data to the scheduler
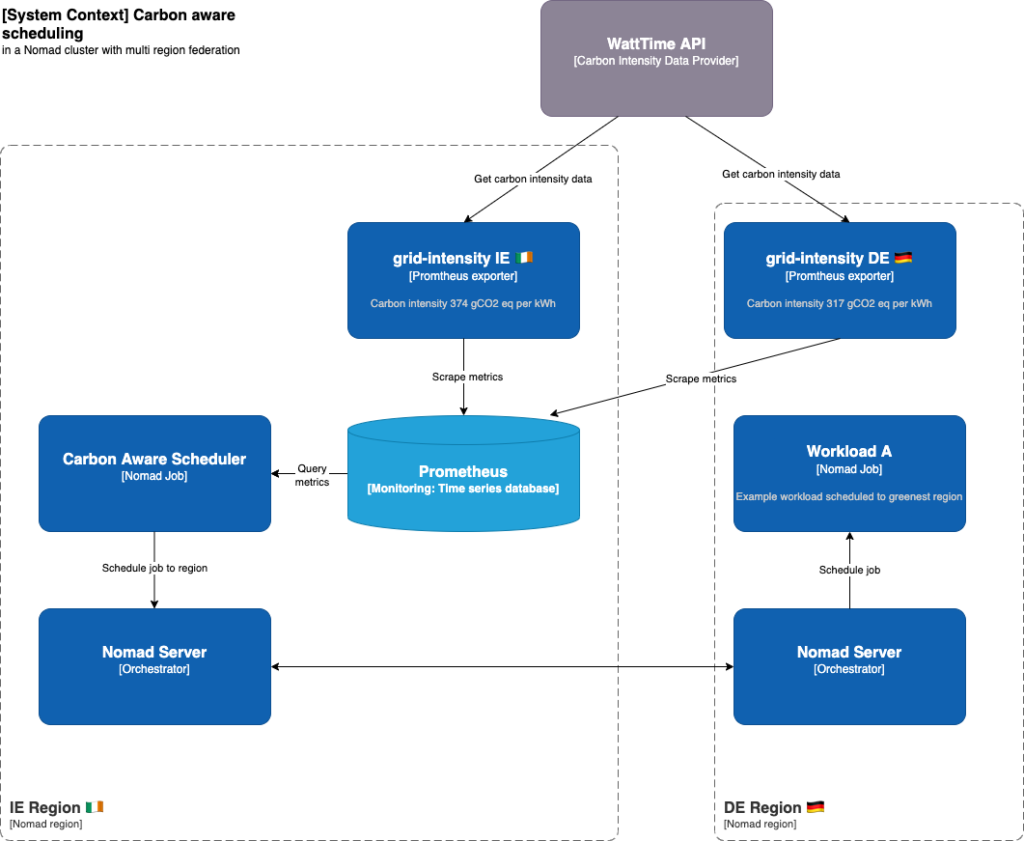
To do carbon aware scheduling we need to expose this carbon intensity data to the scheduler. Both Nomad and Kubernetes have good support for using Prometheus metrics.
At the Green Web Foundation, we’ve created a project called grid-intensity-go that has an exporter for prometheus metrics, as well as a Go SDK and a CLI.
This integrates with multiple providers of carbon intensity data including the ones mentioned earlier.
# HELP grid_intensity_carbon_relative Relative carbon intensity for the electricity grid in this region.

# TYPE grid_intensity_carbon_relative gauge

grid_intensity_carbon_relative{node=”worker-1”,provider="WattTime",location="DE",region=”eu-central-1”,units="percent"} 64
In the example above the exporter is using data provided by WattTime running on AWS in the eu-central-1 region. The location DE is used to fetch the correct data from WattTime. The metric shown is for the relative carbon intensity. This figure is calculated by WattTime for the last month with 1 being the lowest intensity and 100 being the highest.
The relative intensity is kindly provided by WattTime for free and can be used to make scheduling decisions. They also have paid plans if you need the marginal emissions or forecast data.
You can follow a more comprehensive tutorial on our Green Web Foundation documentation site.
Rebalancing workloads by location
If our cluster spans multiple physical locations then we can rebalance workloads to locations with the lowest carbon intensity. In Nomad multi region federation is built in and both jobs and agents (nodes) belong to a region. So a controller could move a job to a region or scale a job per region proportionally.
In Kubernetes a cluster typically exists in a single region. In the paper “A low carbon Kubernetes scheduler” they launch ephemeral clusters in the region with the lowest carbon intensity. The widely used Cluster API design could also be adapted to use this approach. With a controller running in the management cluster launching ephemeral workload clusters.
An alternative approach more similar to Nomad is to use the KubeFed project to do multi region federation. Using its ReplicaSchedulingPreference custom resource, a controller could balance workloads across multiple clusters using weighted proportions.
Rebalancing workloads over time
This is best for batch workloads that are not time sensitive. For example training a machine learning model may not need to happen immediately. The “Let’s wait a while” paper found that in most regions shifting delay tolerant workloads to weekends can reduce carbon emissions by 20%, and shifting to next day can reduce emissions by 5%.
Nomad has an autoscaling plugin for querying prometheus metrics. The carbon intensity metrics can be combined with other metrics like queue length to determine how many instances of a job to run.
In Kubernetes the same is possible using the Horizontal Pod Autoscaler (HPA). The KEDA project builds on top of HPA and adds support for scale to zero. So workloads can be stopped when the carbon intensity is too high. There is a proposal to add a carbon aware scaler using the WattTime relative intensity metric.
Carbon data as a criteria for scheduling decisions
Now we have carbon intensity data we also want to be able to use it to make scheduling decisions. For Nomad there is an experimental carbon branch you can try that does carbon scoring for each node in the cluster. The higher a node’s score, the less likely it is to receive work. It supports getting data from ElectricityMap or Cloud Carbon Footprint.
Kubernetes supports using custom schedulers so a similar approach to the Nomad carbon branch could be used. Another project that looks promising is the Telemetry Aware Scheduler from Intel. As the name suggests it allows scheduling on external telemetry like CPU or power usage but in the future it could also use carbon intensity data.
Other considerations
Outside of Kubernetes and Nomad there are many alternative approaches that can be used. For example in serverless architectures functions are only executed on demand. Or dev and test systems can be shut down at times when they are not in use.
There are also constraints when doing carbon aware scheduling. There may be regulatory requirements to only run a workload in specific geographies. Moving a workload might increase latencies for the users accessing it. Or it may increase data transfer if the data it needs to access is in a different location.
However as well as reducing carbon emissions there are often cost savings and reliability improvements from making workloads more fault tolerant.
What’s next
This post has shown some of the tools and patterns for doing carbon aware scheduling. Try it out on your applications and let us know how you get on. This is a new area so we’re keen to share learning, especially tools and patterns we’ve missed in this post. Reach out on Twitter (@greenwebfound), LinkedIn, or by using our contact form.
If you’re hungry for more, my colleague Chris Adams also covered this in a recent episode of the Environment Variables podcast from the Green Software Foundation.