Dear diary,
Since the start of the fellowship I’ve been learning what I can about the topic of climate justice. I’ve been consuming a lot of media (blogs, articles, books, videos etc) to give myself a grounding and some things to think on.
But I’m really a pictures and diagrams kind of person and I’ve been hankering for a nice diagram, or set of diagrams, that help me visualise the different facets of climate justice. Something that shows the complexity of what we’re dealing with and maybe highlights some key questions to ask.
After a lot of looking, I haven’t turned up anything that’s resonated for me. I’ve found lots of words about climate justice, but surprisingly few diagrams. Mainly pictures of slogans on placards keep coming up. Maybe I’m not looking in the right places… I’m not sure.
Anyway, drawing and explaining diagrams is a way that really helps me engage with a topic so I’m going to give it a go and see what happens.
Looking for existing models
My starting point has been to look for an existing climate justice model that I can use as the basis of my diagram. Something that sets out a way to describe what climate justice is, and rate or evaluate decisions against a set of criteria. Given the complexity of the topic, I know this is going to be a tough ask and sure enough… deep down the rabbit hole I fall…
Unsurprisingly, I haven’t found a single definitive model that’s being used as the climate justice framework, with those exact words. Not saying it doesn’t exist, just saying that after many enjoyable days of trawling through the internet I did not find precisely what I was looking for labelled as “an approach for measuring climate justice”.
But I did discover a ton of useful stuff that appears to drive forward many of the same considerations, and make for super good inspiration. Here’s what I came across.
Doughnut Economics Model
I’ve been familiar with the Doughnut Economics model for a while now, and my first port of call was to explore how well this model sits with the climate justice principles I’m learning about.
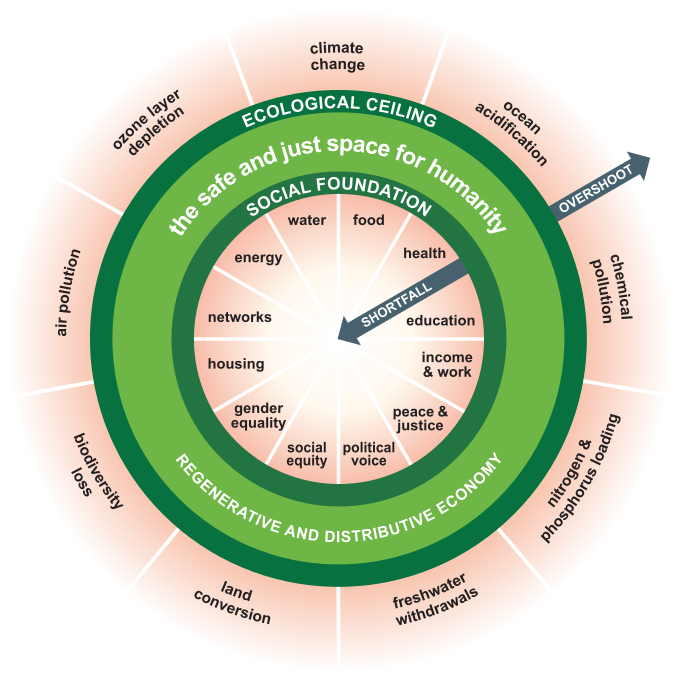
The Doughnut consists of two concentric rings: a social foundation, to ensure that no one is left falling short on life’s essentials, and an ecological ceiling, to ensure that humanity does not collectively overshoot the planetary boundaries that protect Earth’s life-supporting systems. Between these two sets of boundaries lies a doughnut-shaped space that is bothecologically safe and socially just: a space in which humanity can thrive.
About Doughnut Economics
I did a quick search on Ecosia for “doughnut economics and climate justice” and the first result is a case study by Cornwall County Council who are using a doughnut decision wheel. They say the purpose of using it is “so cabinet decisions take full consideration of their environmental, social, economic and cultural impact”. The case study is a really interesting read and shows a way of balancing social justice with climate change mitigation. Seems like a pertinent model.
Anyway, the thing I love about Doughnut Economics is it basically is a diagram. I’m not going to duplicate all the pictures here, but this is the heart of it.
There’s tons of resources on What is the Doughnut? including more diagrams, slide decks and a video. Basically lots of media to help communicate the ideas in engaging ways. As an aside, I found the Doughnut Economics Action Lab community a wealth of incredible resources including stories, case studies and other people to connect with.
UN Sustainability goals
Another angle on models that I went down, was looking at the UN Sustainable Development Goals, which are often referred to as SDGs. These are mentioned as the basis for the social foundation floor in Doughnut Economics and I’ve been wanting to explore these goals for a while.
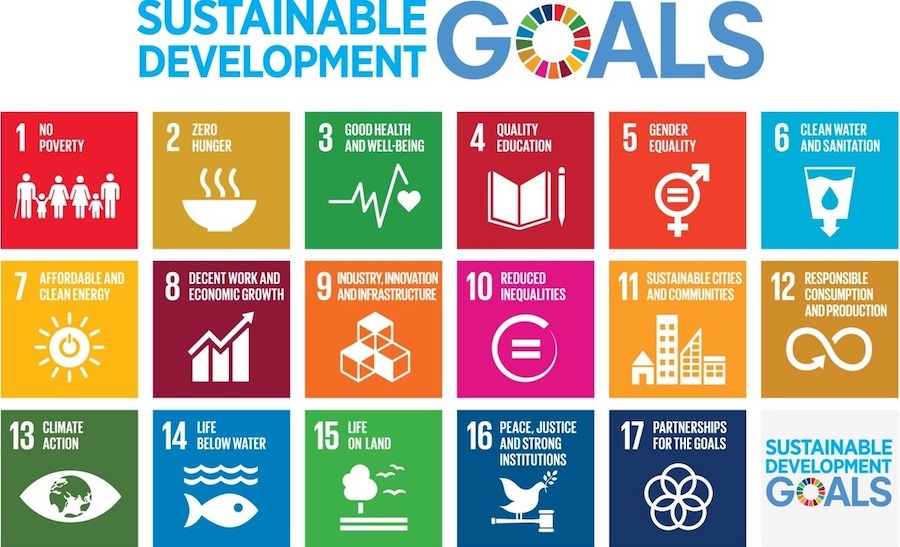
… adopted by the United Nations in 2015 as a universal call to action to end poverty, protect the planet, and ensure that by 2030 all people enjoy peace and prosperity. The 17 SDGs are integrated—they recognize that action in one area will affect outcomes in others, and that development must balance social, economic and environmental sustainability.
UN Sustainable Development Goals website
Here’s a summary of the 17 goals.
In terms of finding a model that can be used, I got lost in the Sustainable Development Goal indicators website for quite some time. Having had quite a bit of experience with ISO standards in the past and corporate reporting, the Global indicator framework was familiar territory for me.
In terms of diagrams, the coloured wheel and blocks they use are very striking, and instantly recognisable. I’ve seen them all over the place before on logos, posters, pin badges etc.
ESG Frameworks
And lastly I spent a fair bit of time looking into Environmental, Social and Governance frameworks, known as ESG frameworks. This area was the least familiar to me, and it seems more like the territory of large scale financial investment and business strategy. But it was dead interesting.
The term ESG stems from a seminal report written in 2004 called “Who Cares Wins”.
Sound corporate governance and risk management systems are crucial pre-requisites to successfully implementing policies and measures to address environmental and social challenges. This is why we have chosen to use the term “environmental, social and governance issues” throughout this report, as a way of high-lighting the fact that these three areas are closely inter-linked.
Who cares wins – connecting financial markets to a changing world – 2004
Like much of this stuff, there’s a lot going on here and many approaches to assessing and reporting.
Something I’m appreciating through this fellowship, is that diversity is a good thing, and whilst I feel a little confused on where to start it’s great to see a lot of approaches. An article called Top ESG Reporting Frameworks, Explained really helped me see through the fog, specifically the part at the end that clarified the differences between 6 key reporting frameworks, including BCorp certification and ISO 26001.
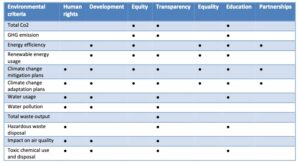
Something that put the concepts of ESG and climate justice together in a way I could get my head around, was a report on the Mary Robinson Foundation – Climate Justice website called Pursuing Climate Justice within Environmental, Social and Governance Investment Frameworks. It provided practical advice on how to combine the two areas of thought, and key questions to ask.
No diagrams in there, but there were some tables showing overlaps and gaps between ESG criteria and climate justice principles which were helpful.
Bonus finds
Whilst hunting for climate justice diagrams, I came across The Doughnut Model, SDGs, ESG factors and SDG entry points – A mapping experiment. In this article, the author had a go at mapping the Doughnut, SDGs and ESGs on to each other to find commonality and overlaps. I found this really interesting, and it demonstrated to me a completeness of the Doughnut model compared to the other approaches.
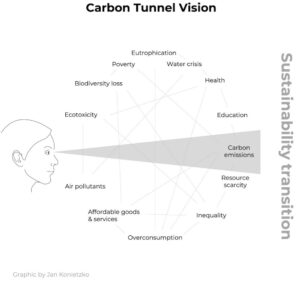
Another interesting find was this diagram by Jan Konietzko called Carbon Tunnel Vision. Whilst it’s about a sustainability transition, it seems wholly relevant to climate justice, specifically the part about how climate justice seeks to shift the focus from carbon emissions and environmental degradation and into civil rights plus environment concerns. Also I like the fact it’s shown as a network, because the issues are so interrelated.
What I’ve drawn
After all that research and a great deal of thinking, I’ve drawn two diagrams.
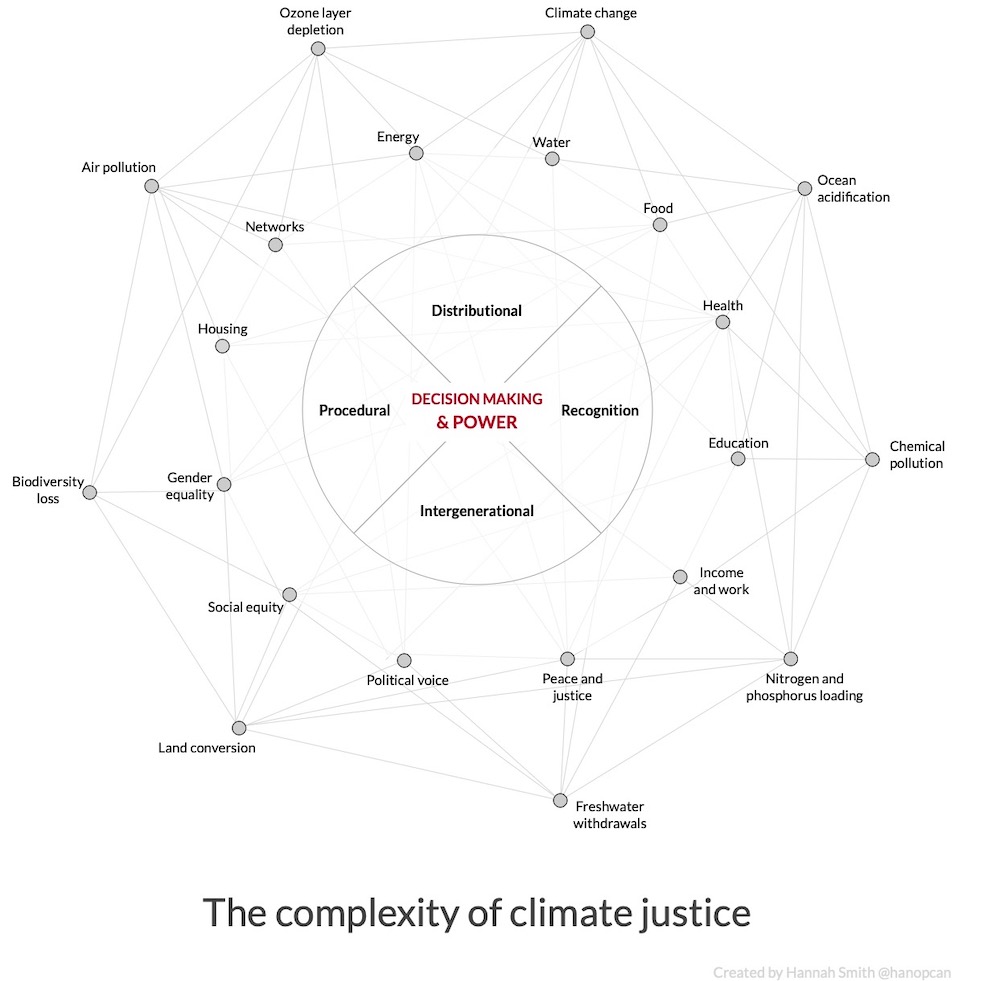
- The complexity of climate justice
The aim of this diagram is to show just how much there is to think about when you consider environmental and social factors.
The diagram is composed of three circles, though they may not be that obvious, and if they’re not I think that’s ok?
- The outermost circle shows the ecological factors as defined in the Doughnut Model.
- The middle circle shows the social factors as defined by the Doughnut Model, which were based on the UN SDGs.
- The innermost circle shows the heart of a fair and just decision making system – the four pillars of climate justice.
The different facets in the two outermost circles are connected with each other like a network. This is not intended to be a mapping of specific relationships, but merely to show that there are relationships everywhere and it’s not trivial. I could have gone as far as literally connecting every point to every other point but I’m not sure if that’s necessary. But I did want to show lots of connections between all the facets and how messy it all is.
It’s the center of the diagram that pulls the strings, so to speak.
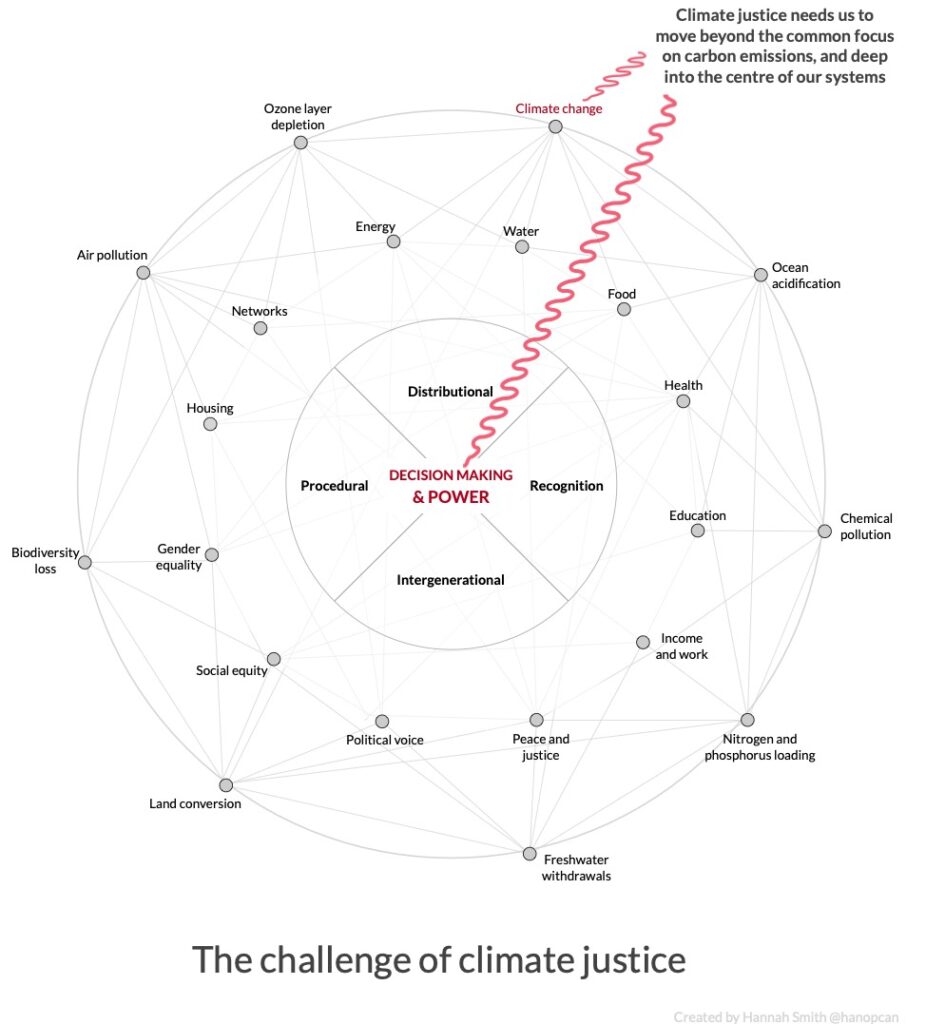
The challenge of climate justice
This second diagram builds on the first. It aims to convey the message that if we want to implement real climate justice, we need to move beyond fixating on carbon emissions and into the difficult territory of changing how our systems work, who makes the decisions and how. We need to get to the heart of the seats of power and change things there, lest we continue to make the same mistakes over and over.
I deliberately drew squiggly lines because I see that shift of power as hard to accomplish. There’s no direct path and power certainly won’t be relinquished easily.
What’s next?
Well as far as these diagrams go, I’ll see what feedback I get from others and whether anybody else finds the drawings useful. I’ve scratched an itch which was to have a go at creating something and I’ve done that. Maybe I’ll continue to improve them, maybe not. Let’s keep an open mind and see what happens next.
Beyond that there’s still some questions I want to answer about how the technology community talks about and recognises climate justice, which I have started a bunch of work on.
I’m also thinking about running another #LetsGreenTheWeb campaign with ClimateAction.tech. That’s another thing I have started thinking about. I’m keen that the 2022 campaign builds in some awareness of climate justice and moves beyond a campaign that just raises the awareness of the carbon emissions of websites, and takes technologists deeper into challenging systemic change.
Much to do! Will write again soon!