
In earlier posts we spoke about Platform, and Process as levers for a lower carbon internet. In this post we’ll talk about the impact of sending data over the wire, and what we might to there, if we took the science around our changing climate seriously.
So far, in this series of posts we’ve been talking about about decisions about how you run infrastructure, as well as decisions about where and how your organisation works in terms of helping us meet the goals we collectively need to meet around reducing emissions.
In both these cases we’ve covered cases where your organisation typically has some degree of direct control over the situation. You make decisions about how you buy or build applications, and someone makes a deliberate decision to have an office somewhere, or how much their staff need to travel, and how they travel.
But what about things you don’t have direct control of?
Sending data over internet uses energy, and is hard to measure
When someone uses your service or site over the web, you have at best, limited control over how they do so and what device they use. This is in many ways a good thing, as it can mean more people can use your it.
But at a systemic view, and you’re of trying to trying to reduce emissions, it can complicate things, and I’ll outline why:
Different energy grids make up the internet
Because different energy grids around the world emit different amounts of carbon to generate the same electricity amounts of, even if every datacentre in the world used exactly the same hardware, two people accessing the same page on your site, or watching the same video on your machine would end up causing different amounts of carbon emissions using our service.
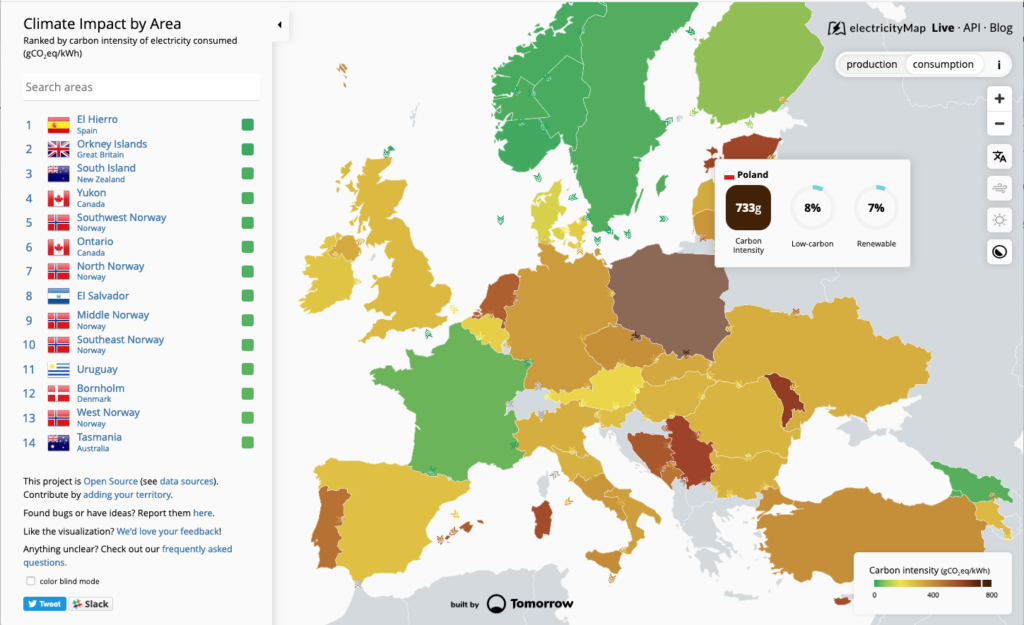
One of the best ways to understand this is to look at Electricity Map, an open source project from Tomorrow that shows this using published open data around how clean, or dirty different forms of energy are, which ones are in use at a given time.
Different infrastructure is used at different times to generate power for the grid
In addition to this, depending on the time of day, you will see different kinds of power infrastructure generating electricity for the grid.
If a grid has loads of solar panels, these won’t generate much energy at night. If it has wind turbines, these depend on there being wind to work too. If you can’t buy power from somewhere where it is is light, or windy, or where they have surplus power, you will need to rely on other forms of power generation to take take up the slack. This works at a micro scale over a single day, but there are also factors that affect how much carbon is emitted by the grid, that work over a longer time period.
Over the last years, the British electricity grid has become much greener, simply down to natural gas being cheaper to than coal to use as a fuel.
This also partly down to the gas prices across Europe being their lowest in ten years, but it’s also partly down to carbon pricing, finally starting to influence decisions on how we power our grids.

Similarly, in the last 6 months in Germany, the carbon emitted to generate the same amount of power has fallen by a fifth, because when we price carbon to take into account the harm it causes, it stops being so attractive. As a result, more than half the coal fired power plants in the EU, are now loss making operations.
Before we start celebrating though, it’s worth remembering there are still plenty in operation – we have a long way to go to get to an entirely green grid.
Sending data over conductive wires, once you have dug the holes is fairly efficient. Using wifi to send data inside a building less efficient, and shorter range, but still relatively efficient.
We’re using more ways to access services, and they all use different amounts of energy too.
However, the energy used for sending data over a mobile network is greater than sending data over a wired or wifi, but the numbers vary. If we go with the figures used by the GHG Standards for ICT, we see a 45-fold increase in the energy needed to shift the same amount of data over a cellular connections compared to wired and wifi, whereas if we use the more recent 1byteModel from the Shift Project, we see just a 2-fold difference. We’ll come back to this later.
Also, as we use faster mobile connections, we are send up sending more data, over more energy intensive connections, and because they’re convenient, we end up using them more too.
When you look at markets outside of Europe or America, it’s not uncommon to see mobile data plans like the one below from Airtel in India, offering gigabytes per day, for less than 3 euro per month.

The impact of 5G on all of this
To make things even more complex, the coming rollout of 5G networks also changes the story for how much energy we use.
To give some context, in the UK, a typical mobile provider uses around 17,000 base stations to provide a mix of 3G and 4G coverage to its users. Because 5G networks rely on shorter range base stations to deliver the faster speeds, we need more of them. Quite a lot more.
For the coming shift to 5G, Mentor, a telecoms focussed management consultancy is predicting a shift to using 50,000 base stations over 5 year for the same area. This is per operator, and with 4 main operators in the UK, we end up with around 200,000 energy hungry base stations needed to provide coverage alone, where we had around 65,000 before.
Even if these used the same energy per base station as earlier ones did, just having four times as many base stations to serve less than four times as many people, further complicating matters.
What you can do when don’t have control over the infrastructure used to access your services
All is not lost though.
Even if you don’t have control over the how much carbon is emitted to move data used by a site or a service, you still have control the emissions from a service by deciding how much data you send to users.
The good news is that over the last few years, we’ve recognised that big, heavy pages can be a problem for plenty of other reasons than climate, and we have a decent set of tools that can we can repurpose.
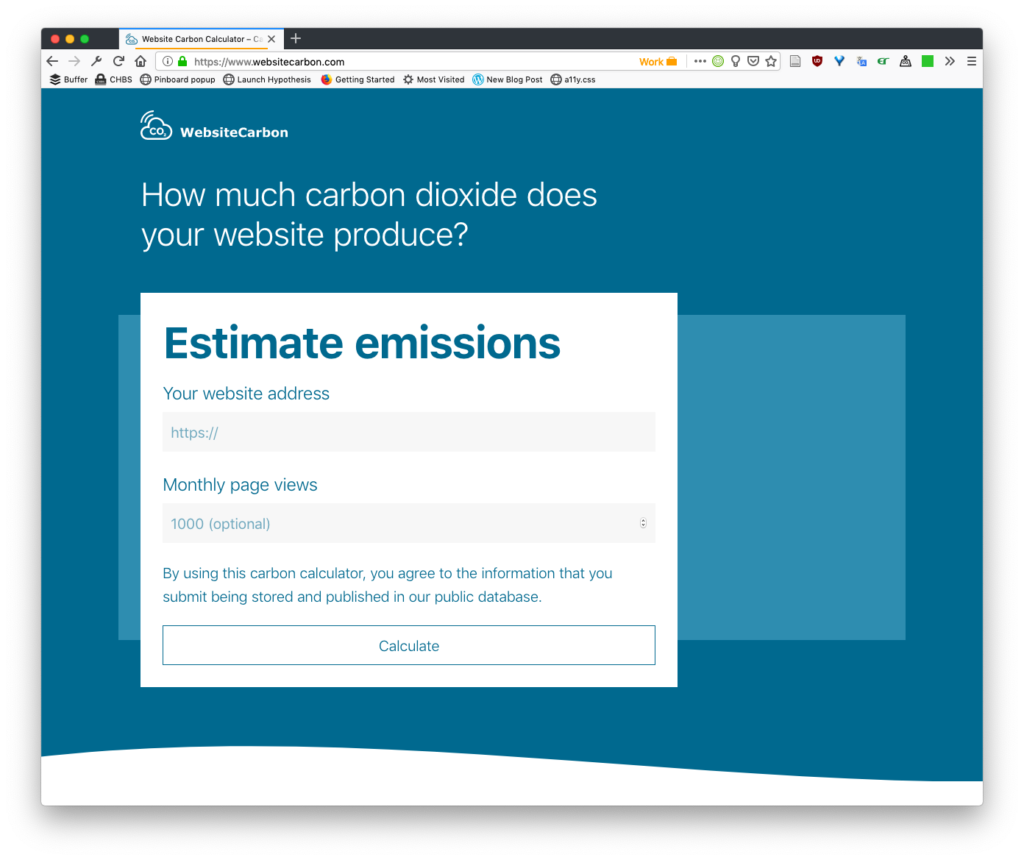
Measuring carbon emissions with Website Carbon
One such example is Website Carbon, from Wholegrain Digital – it measures the size of page, and converts this conversion from gigabytes transferred, to energy used per gigabyte, and finally to carbon emitted for the energy used.
Performance budgets as carbon budgets for websites
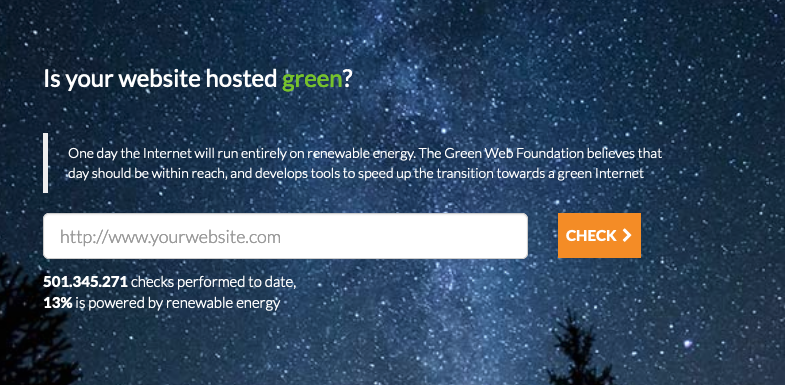
This is good for a one-off check on a website, a bit like the one-off green check for a website, that you can use on our home page.
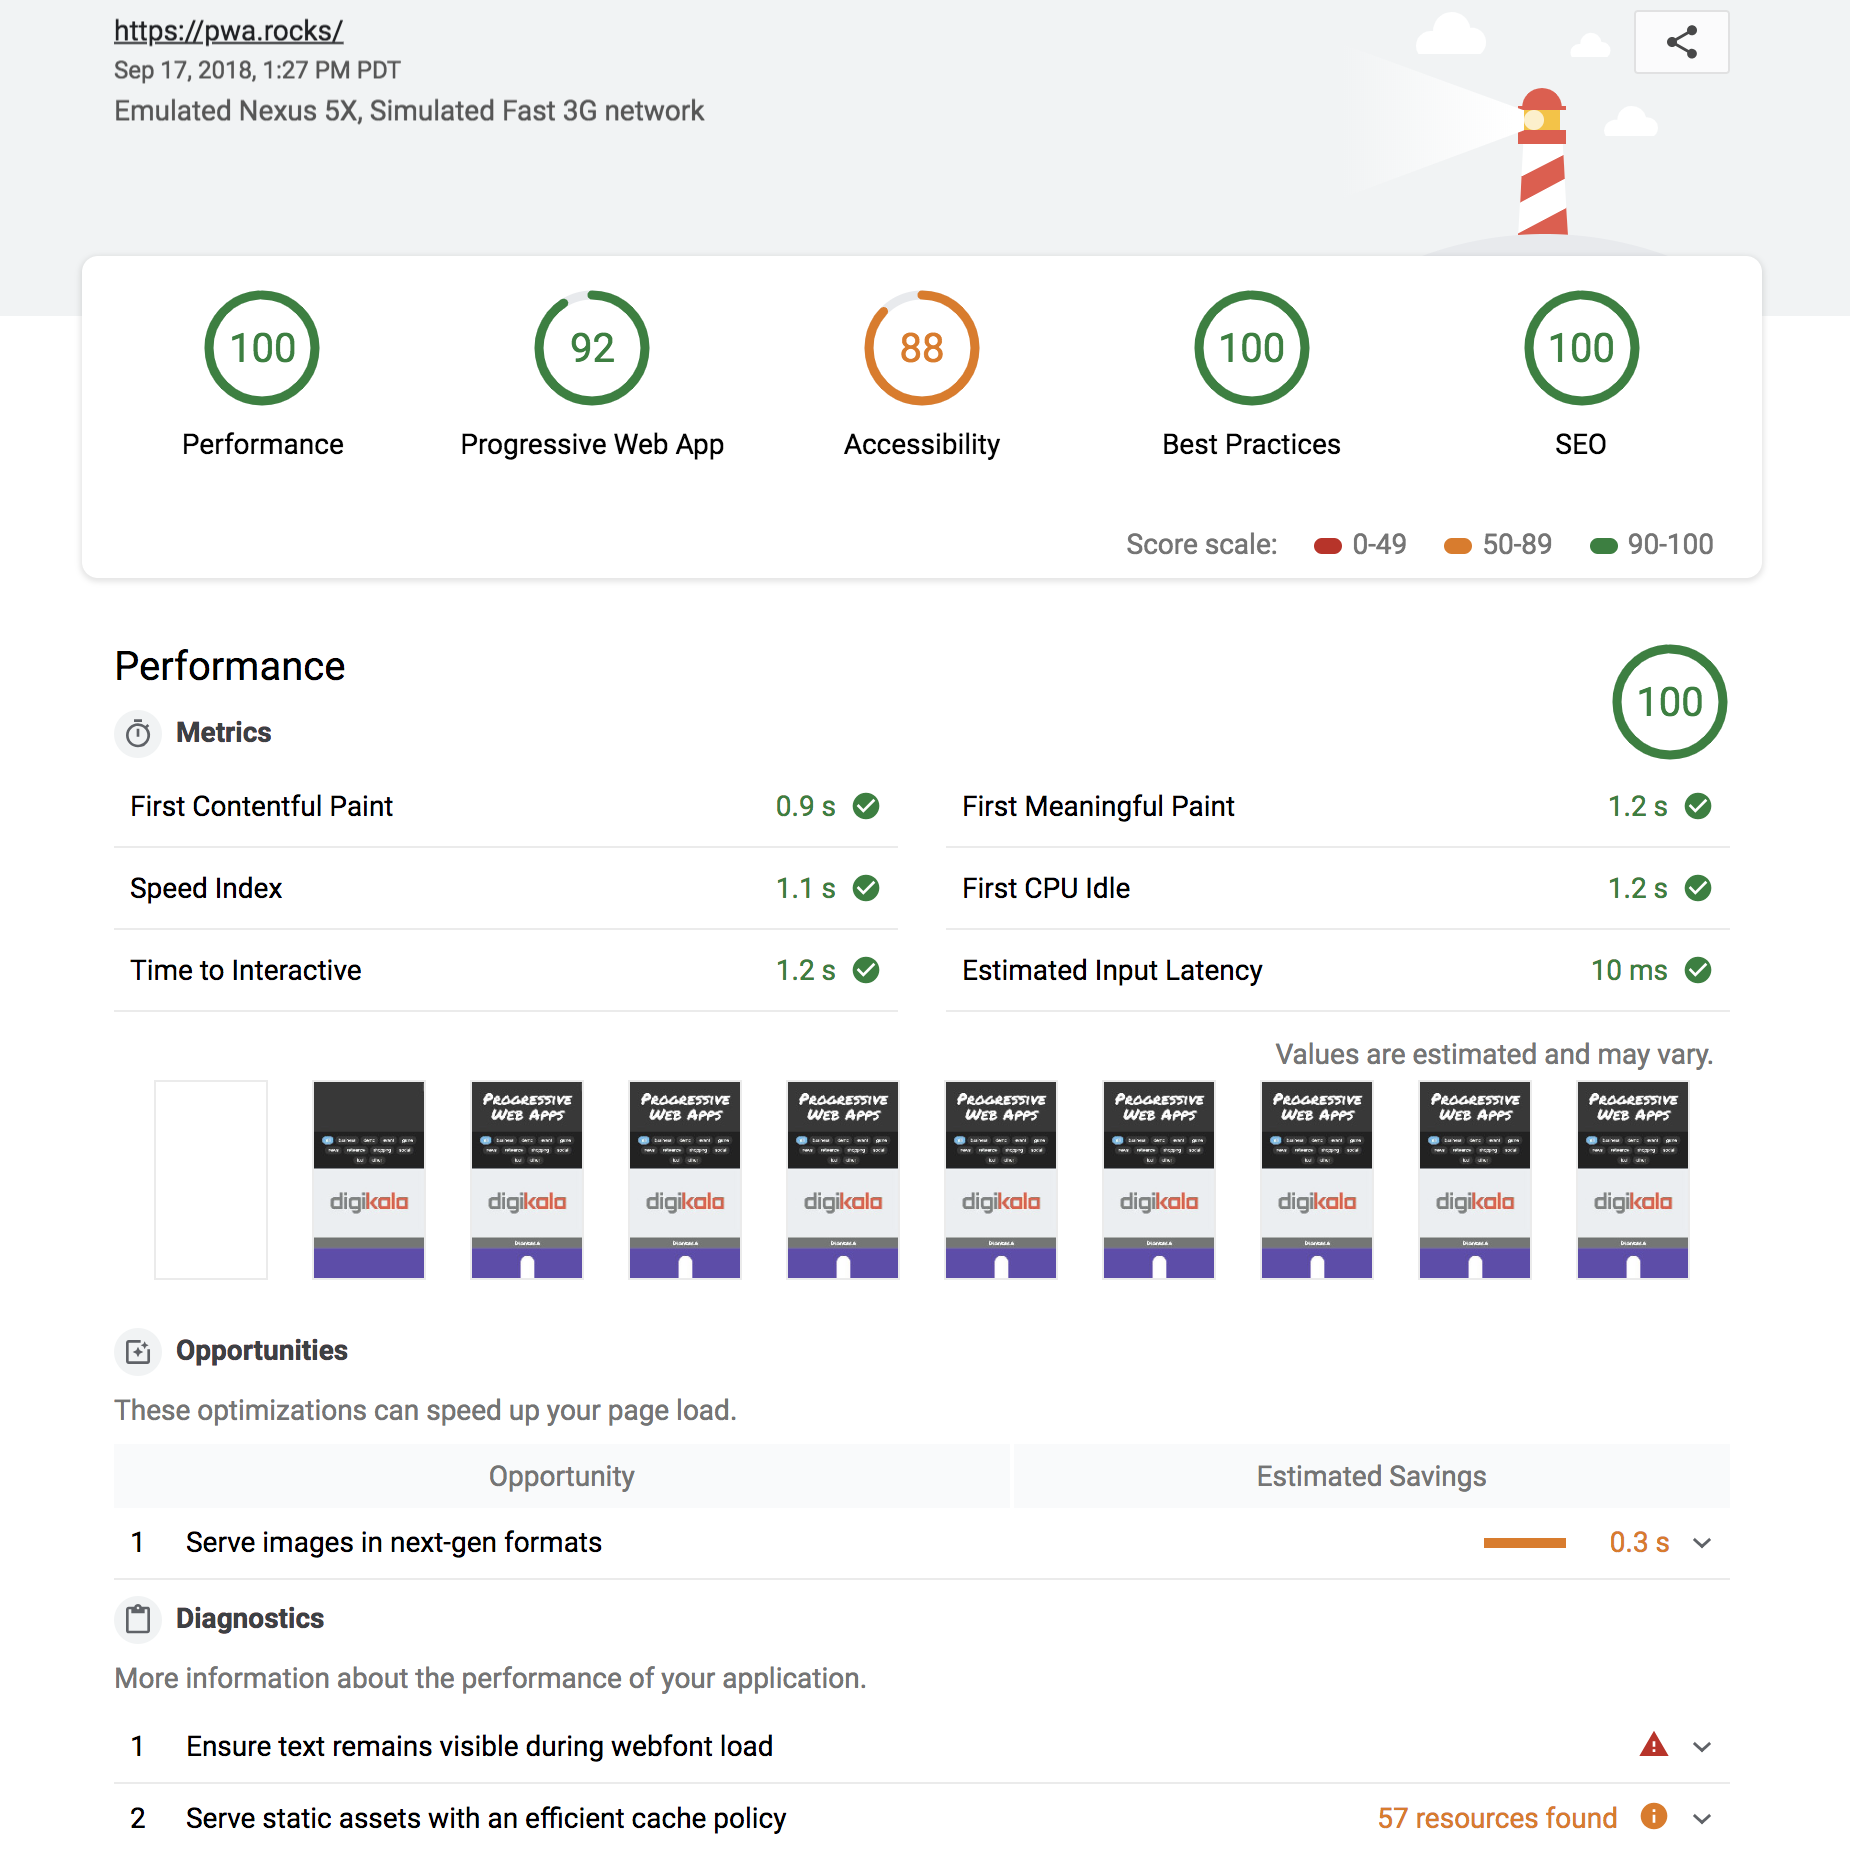
However, an increasingly common approach when trying to keep webpage size under control is to set a performance budget, and the regularly check that a page doesn’t go over this budget, to ensure a fast loading, accessible experience.
You can use open source tools like Google’s lighthouse to enforce these budgets, by automating audits every time code changes, or run them on a regular schedule to catch performance issues on live sites:
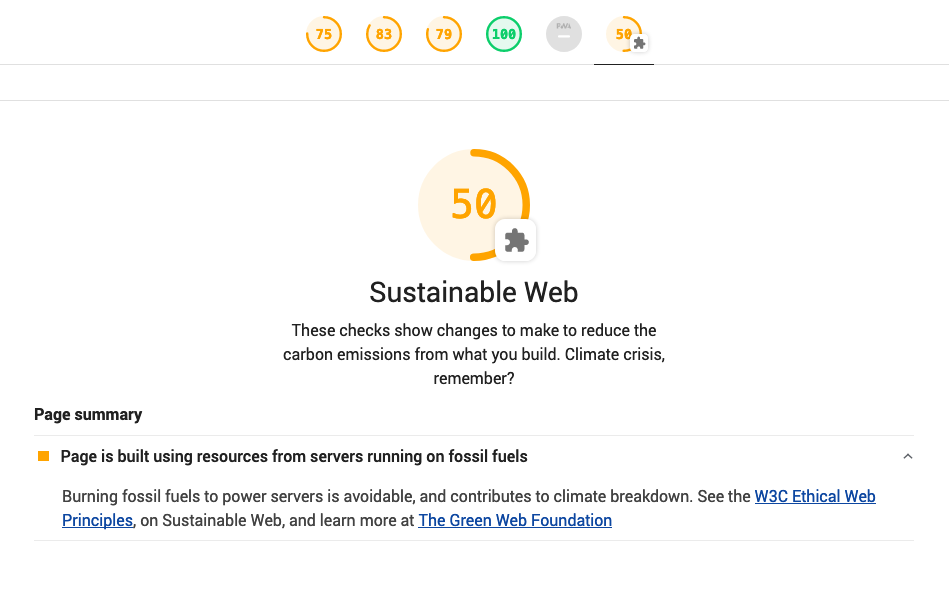
Lighthouse, but for fossil fuels and carbon emissions
We’ve created a plugin now for lighthouse, which we’re calling greenhouse, that lets you audit how green a page is by:
- checking that which servers use to load images, scripts and so on from use green power, and giving you a score based on how many of them are green
- converting the figures for data transfer to carbon emissions using the best methodology we can find, to take into account the things that make it hard to measure.
It’s open source, with a permissive license, and you can see the code on github. You don’t need to be a developer to contribute, and we have an open issue list you can add to if there’s something you want, and can’t see.
Measuring carbon for sending packets is really hard
It’s easy to get carbon measurements wrong, because most of us have no real intuition for what kinds of numbers seem high or not when talking about carbon. And when looking at the web, this is made even worse by the fact that even within the the academic literature, there is a massive range in the figures used for measuring the carbon footprint of moving data.
And when we mean massive, we really mean massive. We touched on the difference for fixed/wifi connections versus mobile before, but there’s a 20,000 fold difference between the lowest figures and the highest figures in peer reviewed papers over the last ten years.
This is like confusing the distance between driving across a city, and driving to the moon, (follow the links to have a go yourself, or see the original report outlining this collosal difference).
Others are looking at this too
Some of this was covered in the recent Mozilla IRL podcast on the carbon footprint of the internet, where they calculated the carbon emissions from their own podcast, which worked out to aroudn a tonne per episode.
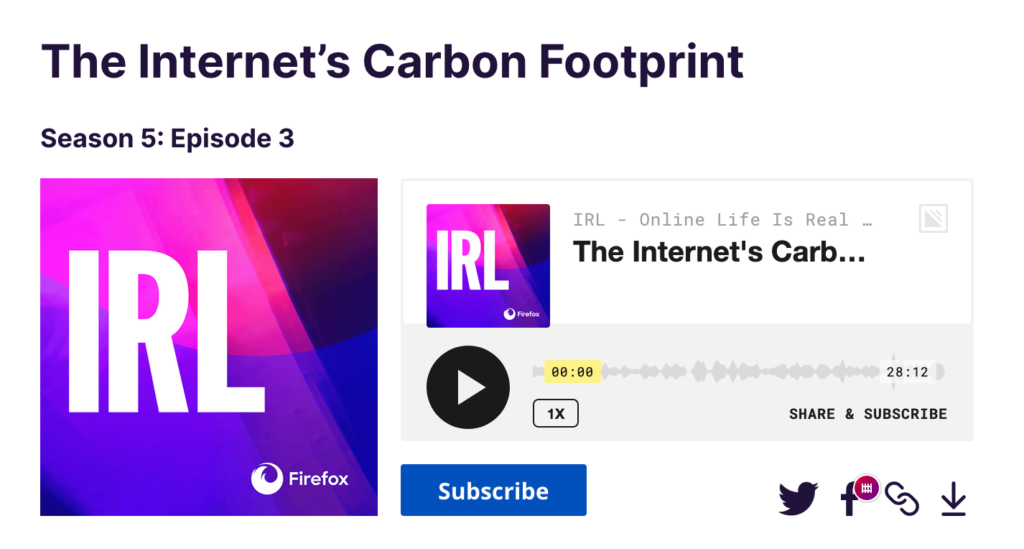
Because they shared the final emissions, the assumptions about how dirty the grid was, and you can also use these numbers to work backwards to get an rough idea of how many listeners they might have.
You can see how this works in this interactive Observable notebook, where we’ve implemented the 1byte model from French think tank The Shift Project.
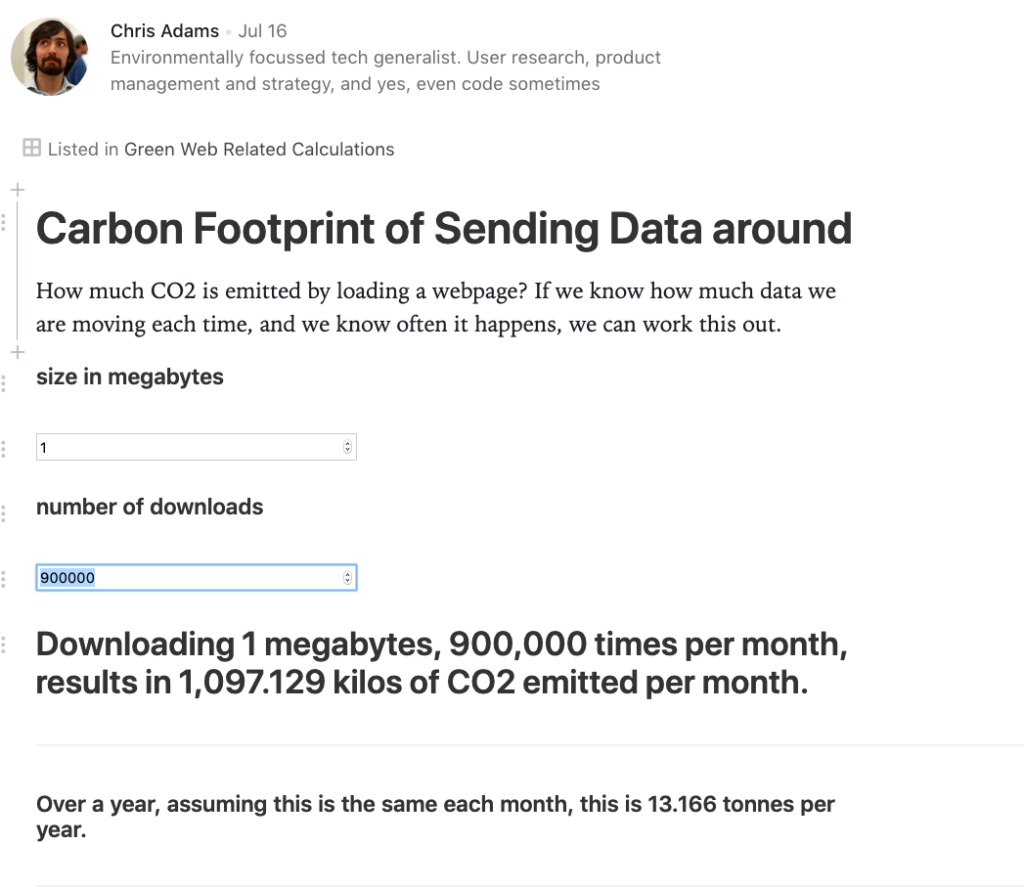
In this example, we’ve left out out the environmental impact of actually buying a device to listen to the podcast on.
If you want to use numbers like this in future, you’ll be able to use this emissions calculation model in your own applications, as part of the work we’re doing to update this open source carbon emissions dataset, and convert it so they’re installable using the popular node package manager.
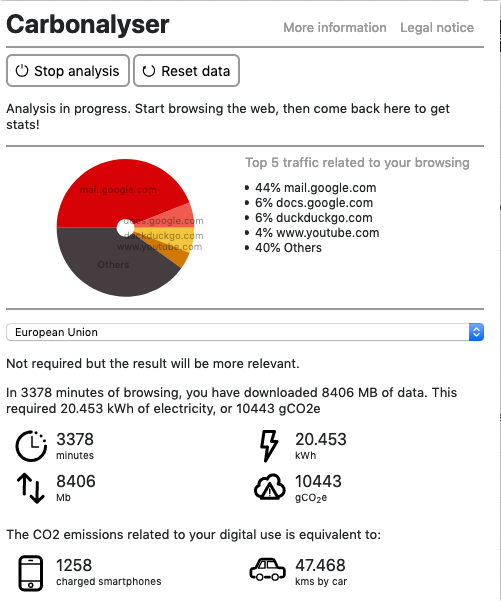
Seeing your own internet footprint with Carbonalyser
Until then, it’s worth checking our the Shift project’s Carbonalyser browser plugin – this will give you a running total of the all the bandwidth you’ve used when browsing the web, as well as showing you the carbon footprint of doing so.
Looking at where impact is with packets, video vs web design
When we’re talking about the environmental impact of sending data around, it’s easy to become focussed the planet-saving aspects of website design, but it’s also worth being aware of what else is using the bandwidth in our pipes.
Earlier this month, the Shift Project published a report with a breakdown of the emissions from transferring data, splitting out the impact of video, versus other types of use.
The results turn out to be pretty eye opening, in more ways than one – Video makes up 80% of the traffic sent over the internet now, of that more than a quarter is porn.
This roughly comparable with all bandwidth of the webpages in all the world.
This is also why we care about decoupling the use of the web, from the emissions caused by using the web – even if we were able to design every web page to be the fastest, lightweight version possible, there’s a risk that any savings would be wiped out by the growth in video, as it is sent at ever higher resolution, and used by ever more people.

Summary
If you care about reducing carbon emissions from the digital services you use and build, we’ve described a number of levers available in this post as well as showing a number of open source projects we maintain, and use.
We’ve covered Google Lighthouse, our plugin Greenhouse, Website Carbon, The Shift Project’s Carbonalyser plugin, and their accompanying reports, about Lean ICT, and online video, as well as sharing a simple calculator for working out the emissions of sending data over the internet.
If you’d like to talk about reducing the emissions from your operations, and greening your stack of technology, we’d love to chat – follow the link to this contact form to learn more.