
For the last few weeks, we’ve been working on a project with the folks who build sitespeed.io, a popular open source web performance tool. We’ve given it the ability to work out the carbon footprint of any website, and provide tailored guidance to measurably make any website greener. Interested? Read on for more.
We know the internet is a wonderful thing. But it’s also the world’s biggest machine, and large parts of it run on fossil fuels. That’s a problem when we’re in a climate emergency.
Now, being in a climate emergency isn’t great, but least the good news is that we’re finally starting to act. So far, 1390 local governments in 27 countries, representing 818 million people have declared climate emergencies in their parts of the world, partly as a response to millions of children striking every Friday, calling for action from adults.
And each week, Greta and Co. have been telling us to, “listen to the science“.
If you do listen to the scientists, you’ll find we need to make rapid, far-reaching and unprecedented changes to how we live and work to avoid the worst impacts of a changing climate.
And although it still needs be happening much faster than it right now, we’re finally seeing actual plans of how to make these changes – see this list of reports and action plans published for the UK already from these same places.
When you look at them, it’s clear we really do have rapid, far-reaching and unprecedented, changes ahead of us. And if we’re going to have an internet in the future, we’ll need it to be a sustainable and green one.
We also know that getting there will take shifts in mindset. After all, we are what we do repeatedly.
So, if we want to keep building websites, we’ll need to find a way to make building sustainable sites a habit.
And if we want to do that, it’s worth seeing what we can learn by looking at how people have created habits out of regularly making fast, accessible sites.
With this in mind, we’ve built a tool for any web designer to make sustainable design part of what they do on every project.
Building a more sustainable web with sitespeed.io
As the cute cats, say:
sitespeed.io is a set of open source tools, that make it easy to measure and monitor the performance of a website.
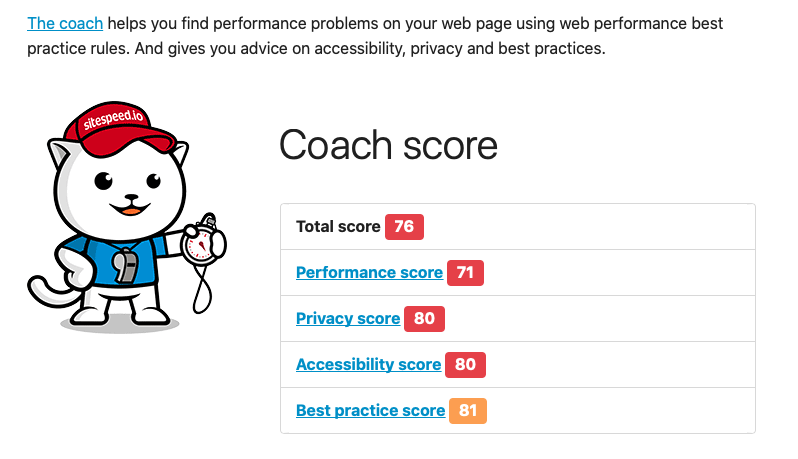
When you use sitespeed.io, (there’s some helpful videos on their website to show how to run it), and point it at a website, it drives a web browser like Chrome or Firefox, to analyse a page, to track how long it takes to load, how accessible it is, and so on.
It then serves up some tailored advice for making a website work better. Here’s an example for the green web foundation.
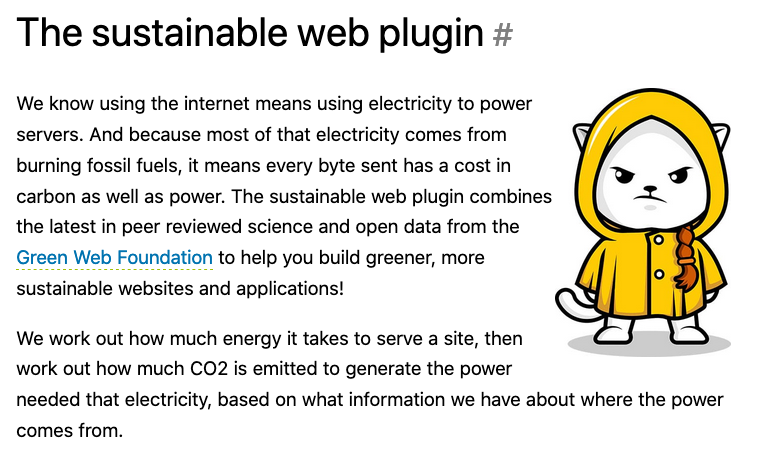
Now, we know that the sending data over the internet uses electricity, which has a carbon footprint, even if the original server serving it is in a green datacenter, because the rest of the internet isn’t green yet.
Until we have an entirely green internet, it means that website performance budgets, where you explicitly say a website needs to be below a certain size, or always load inside a set time, can work a bit like carbon budgets. That is we can use them to influence the emissions caused when we use the web.
This is the key idea is behind the new sustainable web plugin.
Let’s look at the new shiny sitespeed docs for it, with the awesome Greta cat – (yes, of course there are stickers.)
Remember, the W3C explicitly say that building a sustainable web is one of the principles that make up an ethical web.
Inspired by this, we’ve extended sitespeed with a load of metrics, that you’ll find under the “Sustainable Web” tab, as displayed below:
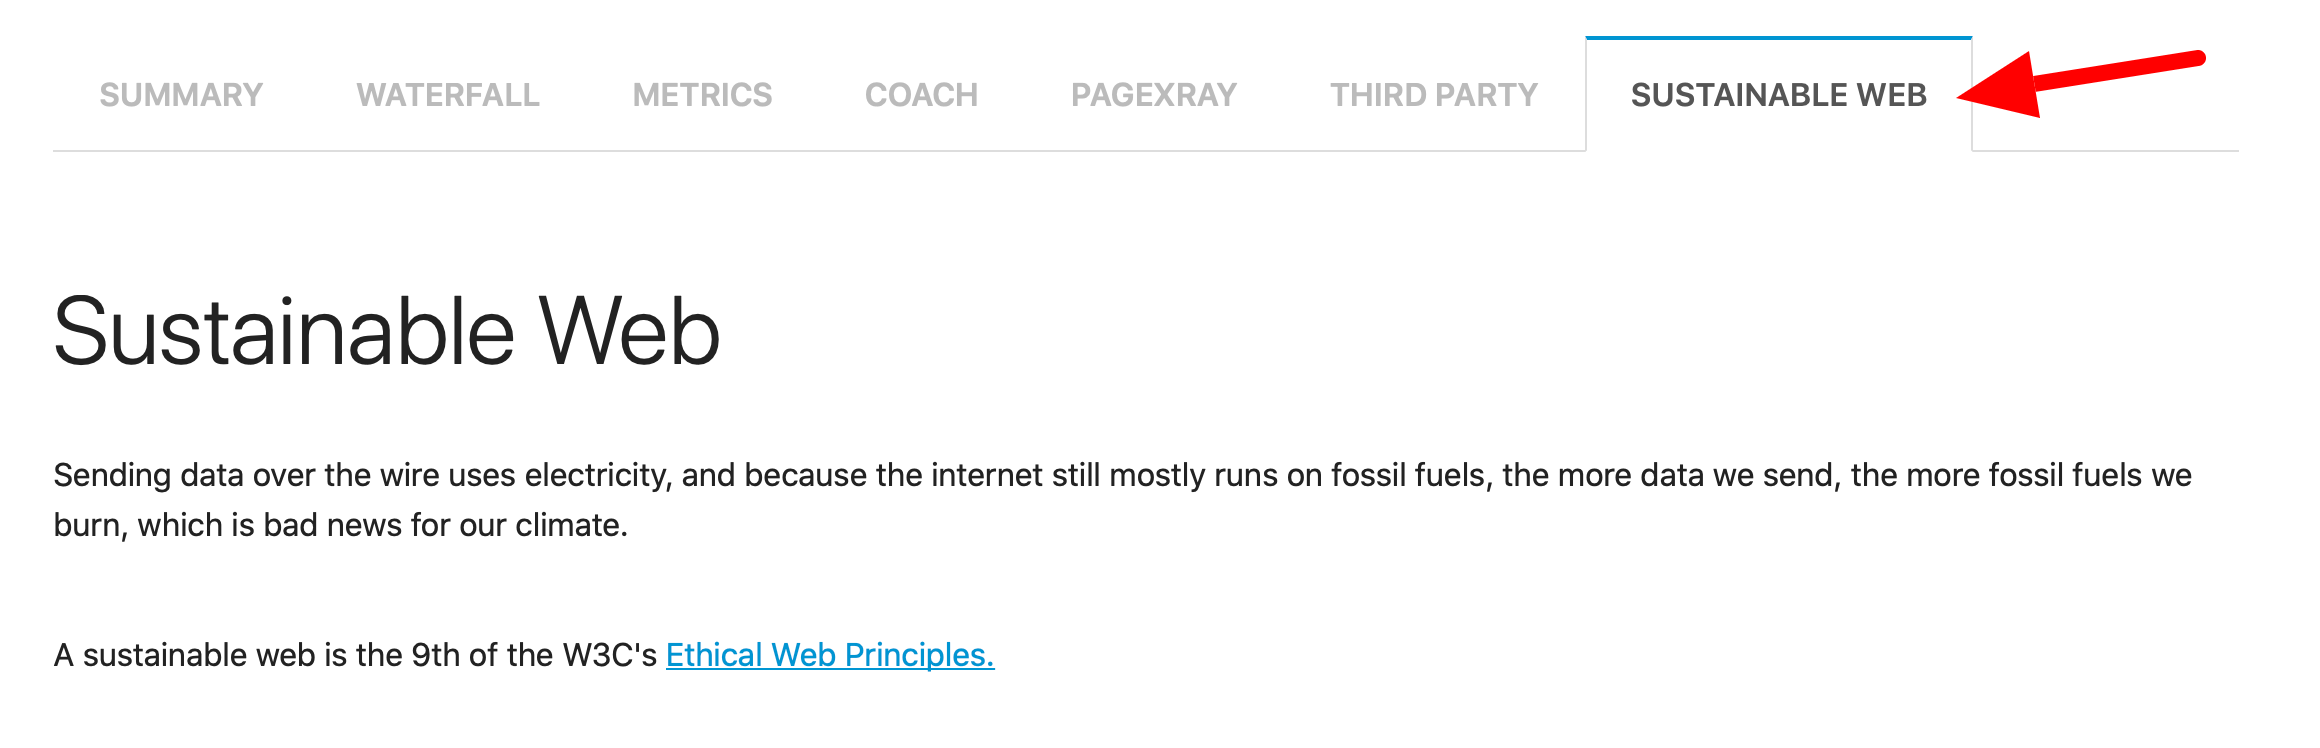
In this tab, you’ll see all the requests that were made to load a webpage, and along with the carbon footprint associated with each one. It also provides a handy breakdown of where the carbon footprint comes from in a webpage, so you know where to optimise first.
If this is harder to visualise, you can have a look at a sample check we ran against our own site to see what we need to do to make it better.
This kind of insight about how pages and services work help us answer some other useful questions.
Let’s try some out.
Is the carbon footprint from my page down to it loading loads of third party javascript, and ads?
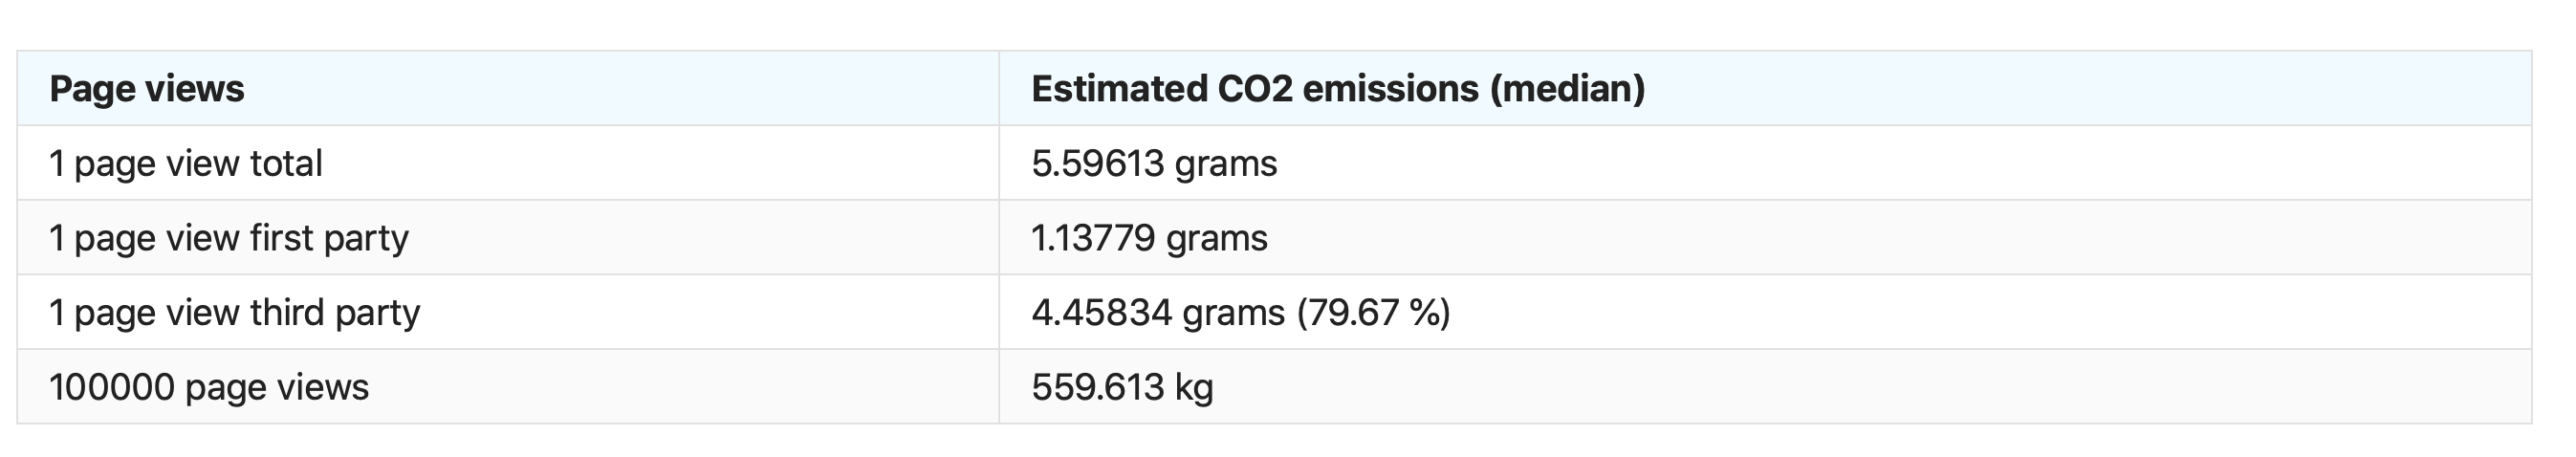
Recent peer reviewed papers estimate that up to half the data sent over the wire, and therefore half the carbon footprint for displaying webpages ends up coming from advertising now.
This means if you’re using a free app, and you pay for bandwidth, you’ll often end up paying more in bandwidth from ads on an app than paying for it outright.
Would it be greener and cheaper for your users just to buy your app, instead of paying for it through the data from advertising?
Now you can start making decisions based on actual data!
If it’s not ads, where is the impact on my page coming from? Is it down to those fonts I added once, and forgot about?
Now we can see! Here’s an example of running sitespeed, and in the analysis, we can see a page breakdown of where the impact comes from.
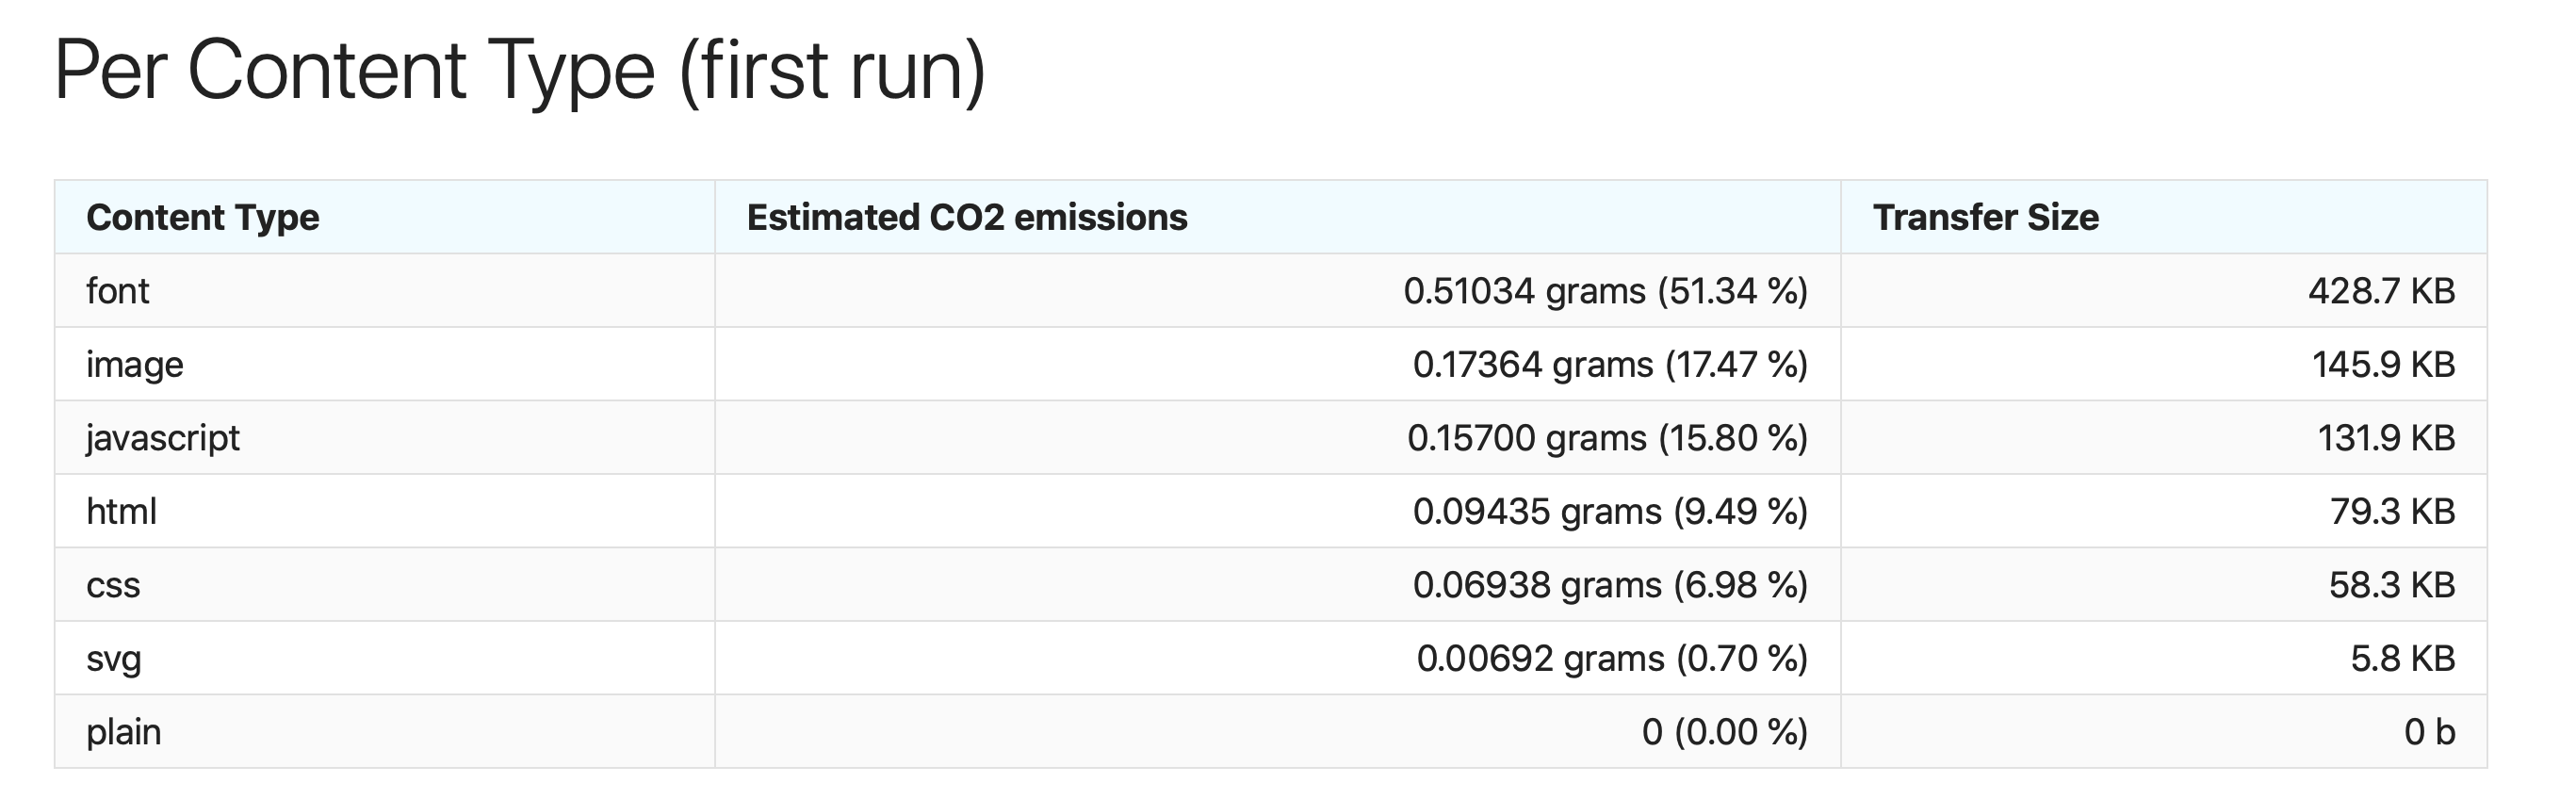
With the content type breakdown, you can have a more informed discussions about how we build greener digital services. Sure that background video they often look cool. But on a recent project, we when we compared the footprint from downloading this video thousands of times to the carbon footprint from the entire team commuting to work over the length of a project, the video ended up having the bigger footprint ?
How does this all work?
As mentioned before, because we use can sitespeed to run all kinds of analysis on pages, we can see how much data is sent from all the different servers that a browser requests info from. We can also check those servers against the Green Web Foundation Greencheck API to see if they run on green power.
Once we know how much data is being sent, we can work out how much energy is being used, by referring to the 1byte model as published by the Shift Project earlier last year.
We then use some more figures from the Shift Project, and the International Energy Agency (IEA) to work out the carbon emissions from generating that energy needed to power all the infrastructure to make accessing the site possible. Where we know green power is used, we adjust the numbers accordingly.
Keeping up with the science
The thing about science is that’s it’s continually being updated, and when we have new data, it’s good to use it.
So, we’re developing the model we use, co2.js, in the open on github, and working with sustainability specialists at Green Gumption and the IEA to make sure we use the latest peer reviewed data when it’s available.
When we have that, we’ll incorporate the new findings into the new open source co2 module we’ve published onto npm, the world’s largest package manager.
Yes, pull requests are very welcome, and we’re actively looking for contributors. In fact…
Using this in your own tools and services
We’re a small team at the Green Web Foundation, so our plan to have outsize impact is to use “open” as a strategy to help shift the norms in how we build the web, and make it easier to help people build greener sites.
If you care about making the web green too, and you’re interested in working with us in this goal, we actively want to speak to other people like you, to build on top of what we’re sharing. Shoot us an email.
