CO2.js v0.12.0 introduces the ability to customise the figures used in carbon emissions calculations when using the Sustainable Web Design model, paving the way for more case specific carbon emissions estimates. This post introduces two new functions that allow for easily traceable changes to be made to emissions calculations.
Adjust constants used by Sustainable Web Design
The Sustainable Web Design model applies a number of constants to its carbon emissions calculation. They are:
- What percentage of visits to a site are new visitors
- What percentage of visits to a site are returning visitors
- What percentage of data for return visitors is downloaded
- The global average grid intensity (442 g/kWh) is used for all segments. Green hosted data centers use a grid intensity of 50 g/kWh.
These constants allow for general carbon estimations to be made using the model. However, in order to return emissions estimates that are more situation specific emissions estimates, developers need to be able to easily make adjustments to these values. The ability to do this has been requested in multiple issues (#120 & #109) and it is now possible through two new functions.
Two new functions
In v0.12.0, we have introduced two new functions which allow developers to pass an options object containing customised values for the constants mentioned above. These new functions are modifications that build on the perByte and perVisit functions:
perByteTraceperVisitTrace
It should be noted that both the perByte and perVisit functions are still present in CO2.js. In the example below, the perVisitTrace function is used to estimate emissions for 1 million bytes.
import tgwf from '@tgwf/co2';
const co2 = new tgwf.co2({ model: 'swd' });

co2.perVisitTrace(1000000, false, {
        dataReloadRatio: 0.6,
	firstVisitPercentage: 0.9,
	returnVisitPercentage: 0.1,
        gridIntensity: {
          device: 565.629,
          dataCenter: { country: "TWN" },
	  networks: 442,
        },
});
Here you can see that we have passed the function an object as the third parameter. Inside of that, we can use the following keys to adjust the constants used by the Sustainable Web Design calculation:
dataReloadRatio– a number between 0 and 1 representing the percentage of data that is downloaded by return visitors.firstVisitPercentage– a number between 0 and 1 representing the percentage of new visitors.returnVisitPercentage– a number between 0 and 1 representing the percentage of returning visitors.gridIntensity– an object that can contain the following keys:device– the grid intensity to use for the device segment.dataCenter– the grid intensity to use for the data center segment.networks– the grid intensity to use for the networks segment.
The values for device, dataCenter, and networks can be either:
- A number representing the carbon intensity for the given segment (in grams per kilowatt-hour). In the example above, we have set
deviceandnetworkgrid intensity in this way. - An object, which contains a key of
countryand a value that is an Alpha-3 ISO country code. In the example above, we have setdataCenterin this way, using the country code for Taiwan (TWN).- When setting grid intensity with a country code, CO2.js will use the average grid intensity data for that is included in the library. If no data is available for the country, then the global grid intensity (442 g/kWh) is used.
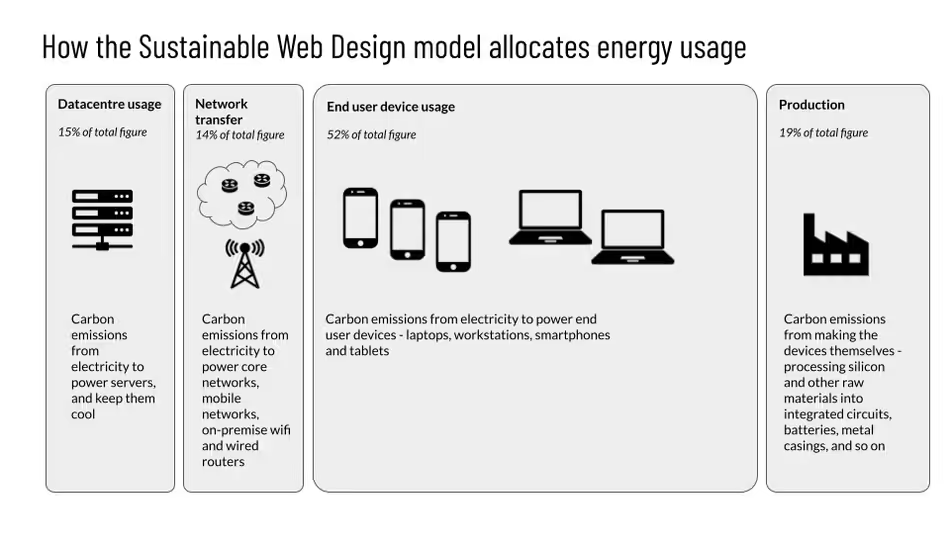
You can learn more about how the system segments used by Sustainable Web Design on their official website. The image below is a visualisation that we have created to help explain these concepts as well.
Traceable results
Since we are allowing developers to divert from the baseline Sustainable Web Design calculation, we have decided to modify the way results are returned in the new perByteTrace and perVisitTrace functions. In this way, developers have a type of audit trail for their results. Let’s compare the results of measuring 1 million bytes using the perVisit and perVisitTrace functions.
import tgwf from "@tgwf/co2";
const co2 = new tgwf.co2({ model: "swd" });

const original = co2.perVisit(1000000);

/* Returns
   0.2703051000000001
*/

const trace = co2.perVisitTrace(1000000, false, {
  gridIntensity: {
    device: 565.629,
    dataCenter: { country: "TWN" },
    // Notice here that we've not included the network key.
   // CO2.js will use the default value if the key-value is not provided.
  },
  dataReloadRatio: 0.6,
  firstVisitPercentage: 0.9,
  returnVisitPercentage: 0.1,
});

/* Returns
	{
	  "co2": 0.4081089199680001,
	  "green": false,
	  "variables": {
	    "description": "Below are the variables used to calculate this CO2 estimate.",
	    "bytes": 1000000,
	    "gridIntensity": {
	      "description": "The grid intensity (grams per kilowatt-hour) used to calculate this CO2 estimate.",
	      "network": 442,
	      "dataCenter": 565.629,
	      "production": 442,
	      "device": 565.629
	    },
	    "dataReloadRatio": 0.6,
	    "firstVisitPercentage": 0.9,
	    "returnVisitPercentage": 0.1
	  }
	}
*/
You can see that while the original perVisit function returns a numeric value, the perVisitTrace function returns an object with the resulting co2 estimate, as well as details of all the variables that were used in the calculation. Let’s go through them one by one.
co2– this is the resulting carbon emissions estimate. It is the value you most likely want to show to users/use somewhere else.green– a boolean that is passed into the function indicating whether the host data center should be considered a green host.variables– an object containing details of all the constants used in the carbon emissions calculation. This object contains:description– a string of text describing the object’s contents.bytes– the number if bytes for which the CO2 estimate is being calculated.gridIntensity– an object containing the grid intensities used for thenetwork,dataCenter,production, anddevicesegments. It also contains adescriptionfield for context.
dataReloadRatio– the value used to account for the data downloaded by returning visitors.firstVisitPercentage– the value used to account for the impact of new visitors.returnVisitPercentage– the value used to account for the impact of returning visitors.
Request for feedback
At present, both these functions should be considered experimental. Their APIs could change in future versions for CO2.js. We hope that they are a useful addition to the library for developers, and eventually plan to make them the recommended way to generate carbon emissions estimates.
In the meantime, we encourage you to try them out and leave us your feedback in the CO2.js Github repository.
Returning segment-level emissions estimates
When working with the Sustainable Web Design model, developers now have the option to return a breakdown of carbon emissions estimates by system segment. This can be used to give a more detailed representation of a carbon emissions estimate.
Returning segment-level emissions estimates can be done by passing a results key with the value of "segment" when initialising CO2.js.
import tgwf from "@tgwf/co2";
const co2 = new tgwf.co2({ model: "swd", results: "segment" });

const byte = co2.perByte(1000000);

/* Returns
	{
	  "consumerDeviceCO2": 0.1861704,
	  "networkCO2": 0.05012280000000001,
	  "productionCO2": 0.06802380000000001,
	  "dataCenterCO2": 0.053703,
	  "total": 0.35802000000000006
	}
*/

const visit = co2.perVisit(1000000);

/* Returns
	{
	  "consumerDeviceCO2 - first": 0.13962780000000002,
	  "consumerDeviceCO2 - subsequent": 0.0009308520000000001,
	  "networkCO2 - first": 0.0375921,
	  "networkCO2 - subsequent": 0.0002506140000000001,
	  "productionCO2 - first": 0.05101785000000001,
	  "productionCO2 - subsequent": 0.00034011900000000005,
	  "dataCenterCO2 - first": 0.04027725,
	  "dataCenterCO2 - subsequent": 0.000268515,
	  "total": 0.2703051000000001
	}
*/
Rather than returning a numeric value, the functions now return an object. In the two results above, the total key represents the overall carbon emissions estimate.
In the perByte function, you can see results for device, network, data center, and production segments. The perVisit function breaks this down further, showing first and subsequent (return) visit emissions for each segment.
Note that this will also work for the new perByteTrace and perVisitTrace functions that have been introduced in v0.12.0.
Try it
Use the Observable notebook below to try out these changes.
You can find details of every release for CO2.js on GitHub, where you’ll also be able find the changelog for this project.
If you are using CO2.js in production then The Green Web Foundation would love to hear from you! Use the contact form on the website to get in touch.